The Scorecard transforms qualitative observations into measurable performance indicators.
Each stage is evaluated on a scale of 1 to 10, based on consistency of execution, system reliability, process clarity, measurable performance, and operational control.
| Score Range | Interpretation |
| 9‑10 | Highly optimized – little to no leakage |
| 7‑8 | Strong performance – minor inefficiencies |
| 5‑6 | Moderate inefficiencies – noticeable leakage |
| 3‑4 | Significant operational weaknesses – major leakage |
| 1‑2 | Severe breakdown – urgent intervention needed |
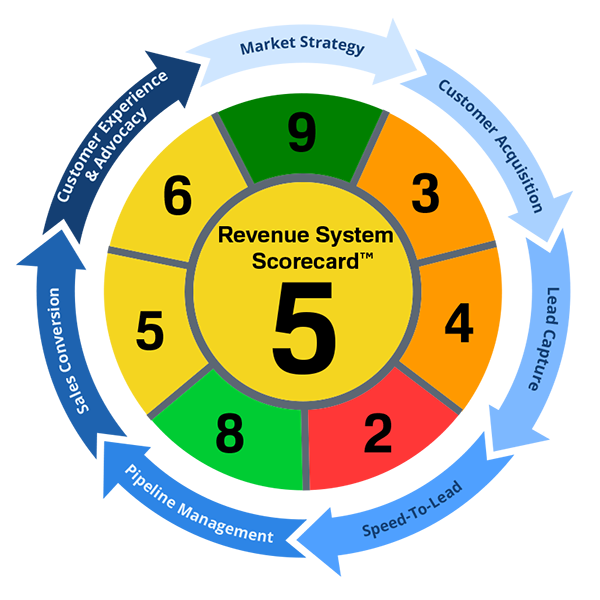
| Stage | Score |
| Market Strategy | 9 |
| Customer Acquisition | 3 |
| Lead Capture | 4 |
| Speed-to-Lead | 2 |
| Pipeline Management | 8 |
| Sales Conversion | 5 |
| Customer Experience & Advocacy | 6 |
Overall System Score: 5 (Moderate inefficiencies)
Interpretation: This business has a severe leak in Speed‑to‑Lead, significant weaknesses in Customer Acquisition and Lead Capture, and moderate issues in Sales Conversion and Customer Experience. Market Strategy and Pipeline Management are strong.
| Tool | Purpose |
| Revenue System Self-Assessment™ | Free, 30-question tool to score your own system (entry point) |
| Revenue System Scorecard™ | Structured performance measurement (this page) |
| Revenue Leakage Map™ | Visualizes where leakage occurs |
| Revenue Leakage Index™ | Financial impact metric from a full Diagnostic |
Revenue Systems Consulting Group helps businesses improve the systems that drive revenue growth.